Home » Software » Chrome DevTools: A Complete Guide to Getting the Most Out of the Developer Tools
Chrome DevTools: A Complete Guide to Getting the Most Out of the Developer Tools
Chrome DevTools allows you to analyze and optimize any website in depth from within the browser.
Its Elements, Network, Sources, and Console panels cover visual debugging, performance, resources, and scripts.
With Lighthouse and the recorder function, you can audit the performance, accessibility, and real user experience.
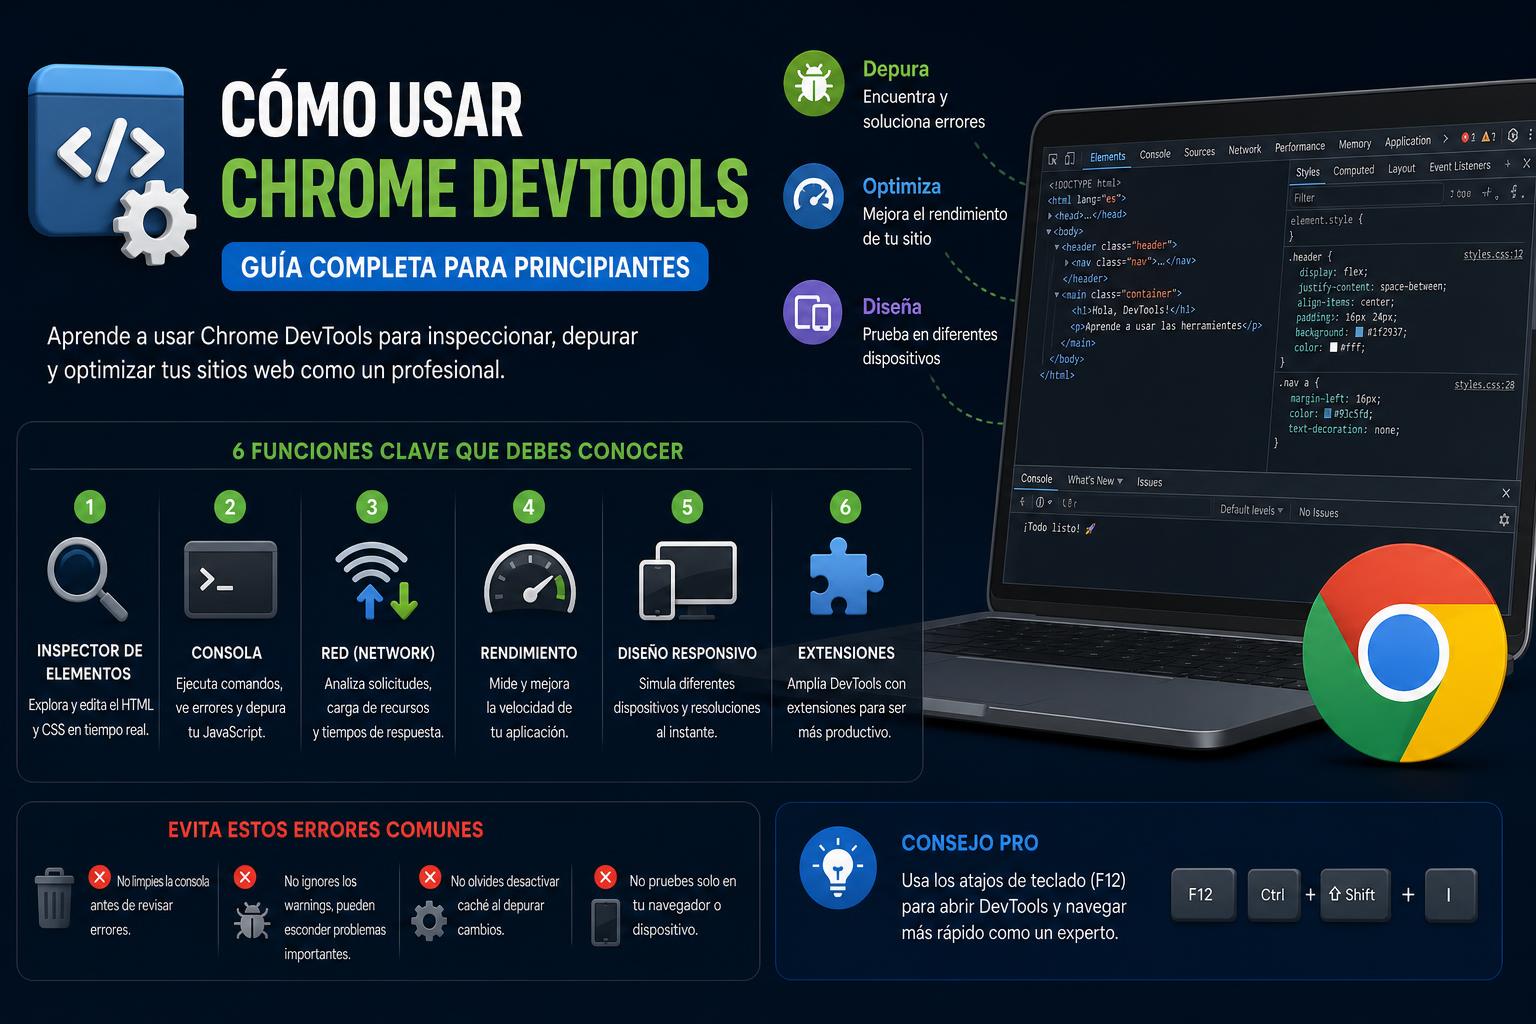
Chrome DevTools has become an indispensable companion for any web developer, designer, or SEO specialist looking to improve a website's performance, accessibility, and search engine ranking. These tools, integrated into Google Chrome, offer in-depth insights and control over website functionality, allowing for everything from HTML and CSS inspection to comprehensive network activity analysis, performance testing, and mobile optimization.
Would you like to master Chrome DevTools and leverage all its features to debug, optimize, and diagnose problems on any website? In this article, we'll clearly explain, with examples and tips, everything you need to know to start getting the most out of these tools, including how to open them quickly, what you can analyze with each panel, what each function is for, and how to apply them in both development and SEO.
What are Chrome DevTools and why are they so powerful?
The Chrome DevTools suite of developer tools is a built-in panel in Google Chrome designed to allow any user to analyze, debug, and optimize the code and performance of any website without installing extra plugins . Through its numerous tabs and features, you can inspect elements, modify styles in real time, track network activity, debug scripts, evaluate performance, and even simulate website behavior on mobile devices . Its scope goes far beyond simply "viewing the source code": it allows you to experience how the website interacts, how Google interprets it, and how a user navigates it from different devices or connections.
How to access Chrome DevTools: Quick shortcuts and context menu
Accessing Chrome DevTools is incredibly easy and there are several ways to do it, depending on your operating system and preferences:
Right-click on the page you want to analyze. and select “Inspect”. This is the most visual and commonly used method.
Use the keyboard shortcuts specific to your operating system: Windows / Linux: Ctrl + Shift + I Mac: Cmd+Option+I
You can also go to the Chrome menu (the three vertical dots to the right of the address bar), and choose More tools > Developer tools.
To open specific panels directly using the keyboard:
Elements Panel (HTML/CSS): Ctrl + Shift + C (Windows/Linux) or Cmd + Option + C (Mac)
Last panel used: F12 (on most systems) or Ctrl + Shift + I / Cmd + Option + I
Open DevTools automatically in every new tab (very useful for those who spend their time debugging): run Chrome with the option --auto-open-devtools-for-tabs from the command line.
Don't forget: when you open DevTools, you can decide whether you want to pin them to the right, left, bottom of the window, or even in a separate window—something especially handy if you work with multiple screens.
What can you do with Chrome DevTools? A look at its main features
Chrome DevTools is divided into multiple panels. Each one covers an essential aspect of web analysis and optimization. Here are the most commonly used panels and their most relevant functions:
Elements Panel: Live inspection and editing of the DOM and CSS
This panel is the starting point for most debugging and visual analysis tasks. It allows you to:
Inspect the exact structure of the DOM (Document Object Model) that the browser is rendering, that is, what Google actually sees after running scripts and loading styles.
Modify HTML and CSS on the fly, instantly checking how the changes look on the website (great for prototyping or testing new style rules without affecting the actual source code).
Manage classes and styles of the elements: you can activate, deactivate or test new classes and edit visual details for responsive design.
View and manipulate special attributes (such as data-nosnippet), which are fundamental for SEO, as you can check whether Google will be able to index certain content or not.
Check if there are elements or blocks that are only visible after a user action (for example, tabs or dropdowns that require JavaScript to be displayed).
Quick access to the inspected item on the console as $0, allowing you to manipulate it directly via JavaScript.
Tip! You can also simulate different screen sizes and mobile devices from this panel, ensuring your website is truly responsive.
One of the essential dashboards for performance analysis . Here you can see it, chronologically and in detail:
All the resources requested when loading the page (HTML, images, CSS, JS, videos, fonts, etc.).
In what order are they downloaded, the loading time, and the size of each resource: key to identifying bottlenecks or unnecessary resources.
By clicking on each resource you can check the HTTP headers, caching policies, response times, and even see if there are minimized files.
Simulation of slow connections (3G, 4G, etc.), to see the real performance on your users' devices and not just on your own computer.
Function for Clear cache and reload, useful for checking the experience of a new user.
Request blocking: analyzes the impact of dispensing with certain resources (for example, disabling main.css and seeing how the page becomes misconfigured).
Advanced filtering: search by file type, source domain, regular expressions or specific attributes, ideal for auditing external downloads or monitoring security.
Taking screenshots at various points in the page load, allowing you to see what is being shown to the user step by step.
Specifically for SEO and WPO: analyze what loads first and how that affects performance and Web Vitals , understanding how to optimize the experience for Google and your visitors.
Console Panel: Debug, run scripts, and get real-time alerts
In the Console you can view logs, JavaScript errors, and security alerts issued by the website in real time. You can also:
Execute JavaScript commands directly on the open page, ideal for quick tests or automations.
Interact with the last inspected element using the variable $0 (and $1, $2, etc.), speeding up advanced debugging.
Click on errors or warnings to go directly to the line of the offending JS file.
Sources Panel: View and debug static files and external resources
This section displays the structure of files uploaded to the website : scripts, styles, images, etc., organized by domains:
Find out if you use external resources, such as Google Fontsand is considering hosting them locally to gain speed.
It allows you to open, edit, and save source files for testing.
Analyze minified scripts, expand code for greater readability, and check for hidden dependencies.
Recorder: Simulates a user's journey and measures their real experience
The recording function allows you to simulate a user's actual browsing and identify specific problems:
You can record a navigation flow (e.g., clicking on menus, filling out forms, moving from one page to another), check how the website responds, and analyze the loading times of each action.
Ideal for detecting bottlenecks in critical paths for conversions or UX.
Lighthouse: Comprehensive audit of performance, accessibility and best practices
Lighthouse, integrated into Chrome DevTools and also available as a plugin , is a star feature:
Performs automatic audits performance (WPO), accessibility, best practices, SEO and PWA (progressive web applications).
Provides a overall score and actionable recommendations for each section, both for websites already published and those under development.
It allows you to analyze the website in desktop and mobile mode, making it very useful for identifying mobile friendliness problems.
Practical applications: How to leverage DevTools for WPO and SEO
Chrome DevTools are a fundamental tool for website optimization at all levels: from initial design to ad request analysis and on-page SEO auditing. Some key uses include:
Performance Optimization (WPO)
Identifies images and large files from the Network tab and prioritize its optimization (compression, new formats, lazy load).
Evaluate the external resource loadIf the times are long, consider downloading them from your own server.
Reorder the loading priority so that critical items are served first (Critical Path).
Disable the cache from the Network panel When analyzing changes, ensure that the information is not stored locally.
Use the slow connection simulator to test the mobile user experience.
Resource minimization (CSS and JavaScript)
In the Fonts tab, locates oversized, unminified, or duplicate files.
Unify and minify CSS and JS to reduce requests and improve load times.
Structural analysis, accessibility and SEO
Review the structure of headings, attributes, and HTML semantics: make sure that the logical structure (h2, h3, ALT tags, roles) is optimal for Google.
Check with Lighthouse the presence of necessary labels and data for SEO, accessibility, and PWA.
Analyze the impact of JavaScript on rendering and keep in mind that Google may not interpret what depends on user interaction if it is not visible when loading.
Monitors the use of cookies, local storage, and other browser resources.
Extraction and manipulation of content for scraping or export
You can use "Copy element" to directly export large tables or lists to spreadsheets or code editors.
Use the console and Design Mode to efficiently edit on-screen content, prepare captures, or export relevant information.
Real-time customization and debugging
Hide advertising banners or annoying elements directly by applying display:none through the inspector.
Use JavaScript from the console to execute commands on selected elements or even toggle page edit mode on and off.
Limitations of Chrome DevTools on mobile devices
Although "Inspect Element" and all Chrome DevTools are always available on desktop versions, DevTools aren't directly available on smartphones and tablets . There are two reasons for this: the interface would be impractical on small screens, and mouse precision is compromised. Fortunately, you can emulate the mobile experience from your desktop or even connect a physical device to your computer to debug sites in real time, which is especially valuable for mobile app developers. On a Mac with iOS, you'll need to enable the corresponding option in "Settings > Advanced" and use the same iCloud account on both devices.
Advanced use cases: from debugging to taking screenshots
In addition to the classic uses in SEO development and analysis, Chrome DevTools offer very practical advanced features:
Blocks the loading of specific files (example: main.css) to simulate network failure scenarios and check how the website behaves in the event of failures.
Use the screenshot function within the Network panel to see the rendering process step by step and thus better understand how and when certain key elements appear.
Search for specific HTTP headers or responses (e.g., to find out which resources use optimal caching policies) using the global search function.
Filter requests by type, domain, or pattern to analyze external traffic or critical resources in detail.
Create rapid prototypes of HTML and CSS changes and easily share them with your team, without needing to alter the original source files.
Chrome DevTools has become the Swiss Army knife of web development and analytics, working equally well for personal projects or large platforms and professional projects. From quickly inspecting a design detail to fully auditing all your website's resources, including WPO, SEO, and accessibility tasks, its integration with tools like Lighthouse makes it an essential resource for optimizing your pages not only for Google but also for your users.